
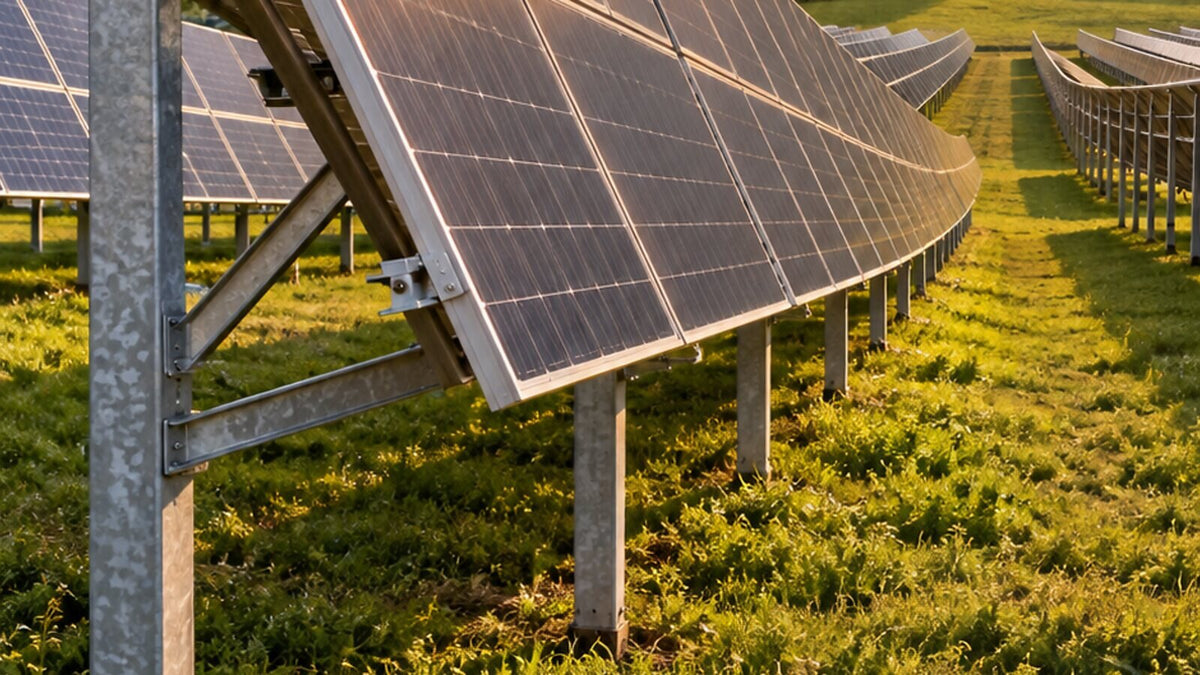
In a solar park, the structure influences the investment, the energy yield and how the installation behaves over time. A seemingly small difference in profile, bracing or the distance between tables is multiplied across the entire project. At Nectaria Solar, the comparison starts with the technical solution: how much steel it includes, what loads it is calculated for and how it uses your land.
The first question: how many tonnes of steel do you get per MW?
Ask each manufacturer for the steel consumption relative to the same installed panel capacity and the same list of included components. Check whether the weight covers the piles, beams, rails, bracing and joints. This way you can compare the quotes and quickly identify what explains a large difference.
In our experience, a very cheap quote deserves a close look at profile thickness and bracing. Unjustified reductions here can leave the structure too flexible, with deformation under snow. The principles for verifying strength and stability are described in the Eurocode for steel structures.
As an order of magnitude, the fixed structures published by manufacturers range from about 26–28 tonnes per MW for smaller panels, in the datasheet of a fixed-tilt structure manufacturer, to more than 40 tonnes per MW in configurations with strong wind and large panels. When one quote comes out well below the others for the same panels and the same site, ask exactly where the steel has been reduced.
Tonnes per MW are a comparison indicator that must be read together with the design. A lighter structure can be well optimized through suitable sections and materials. Ask for the thicknesses, the steel grade, the bracing scheme and the calculation for the site. Then you can see whether the difference comes from efficient design or from elements that have been removed.
Why 25° is so often quoted
In quoting practice, a structure at 25° is often cheaper than one at 30°. The lower geometry can allow shorter elements, and the required distance between rows decreases for the same shading criterion. The steel saving is confirmed by the bills of materials of the calculated options.
For the investor, the advantage can come from cost and from land use. The trade-off is the yield per installed capacity and its distribution over time. In the south, 25° can be an attractive commercial compromise; in Transylvania it is worth comparing carefully with steeper tilts. The result is determined for the site, orientation and available space.
What the PVGIS comparison shows
We compared south orientation, free-standing mounting, crystalline silicon, conventional losses of 14% and the same capacity of 1 kWp, using the PVGIS-SARAH3 database. The data are climatological averages for 2005–2023. The assumptions can be followed in the PVGIS documentation and in the calculations linked below.
For Alba Iulia, the calculation gives 1,222.48 kWh/year at 25° and 1,236.74 kWh/year at 30°: a gain of approximately 1.17%. The annual optimum is 38° under these assumptions.
For Giurgiu, the values are 1,290.61 kWh/year at 25° and 1,302.47 kWh/year at 30°, i.e. approximately 0.92% more. The annual optimum is 35°. The production optimum and the economic compromise are therefore calculated separately.
These results do not separately account for inter-row shading between tables. An angle with better yield per kWp may require more land; the total energy of the park also depends on how many modules you install and on the actual shading losses.
Row spacing must be calculated
For level ground, identical south-facing tables and lower edges at the same height, the geometry at solar noon can be written as follows: H = L × sin β; B = L × cos β; d = H / tan α; P = B + d. L is the sloped width of the table, β the tilt angle, α the solar elevation, d the clear spacing, and P the pitch between corresponding points of the rows. The relationship is explained in the university course material on PV array geometry.
At a latitude of 46° north, at noon on the winter solstice, the example with α = 20.56°, L = 4.40 m and β = 30° gives H = 2.20 m, B = 3.81 m, d = 5.87 m and P = 9.68 m. At 25°, the same example gives a pitch of approximately 8.95 m.
This is a geometric example for noon. In the morning and afternoon, the slope of the ground and the horizon change the shadows. The design must choose the time window to be covered and the acceptable loss, while preserving the necessary access and roads.
Snow, wind, foundations and corrosion
Loads are determined for the site, using CR 1-1-3 for snow and CR 1-1-4 for wind (the Romanian design codes). The snow value is read for the exact locality: in Transylvania, as in some areas of the south, the structure must be checked for serious loads, and a lower tilt does not automatically guarantee lower wind loads.
For foundations, ground assessment and pull-out tests help determine the pile solution and depth. The technical process for on-site testing shows the role of these tests. Corrosion protection is also chosen according to soil aggressiveness, and module height is set with regard to snow, vegetation and maintenance.
Installation capacity and organized execution
Nectaria can install 5–10 MW per month, with crew organization and supply adapted to the project. The schedule is coordinated with site preparation, access and component delivery. For us, the pace of work must preserve the designed configuration and the quality of the fixings.
In the structures collection you will also find stiffening components for ground-mounted installation. At the scale of a park, the configuration and bill of materials are determined for the whole project.
To have the structure analysed and the installation of your park organized, contact Nectaria Solar on 0723 172 359.

Leave a comment
This site is protected by hCaptcha and the hCaptcha Privacy Policy and Terms of Service apply.